



Introduction
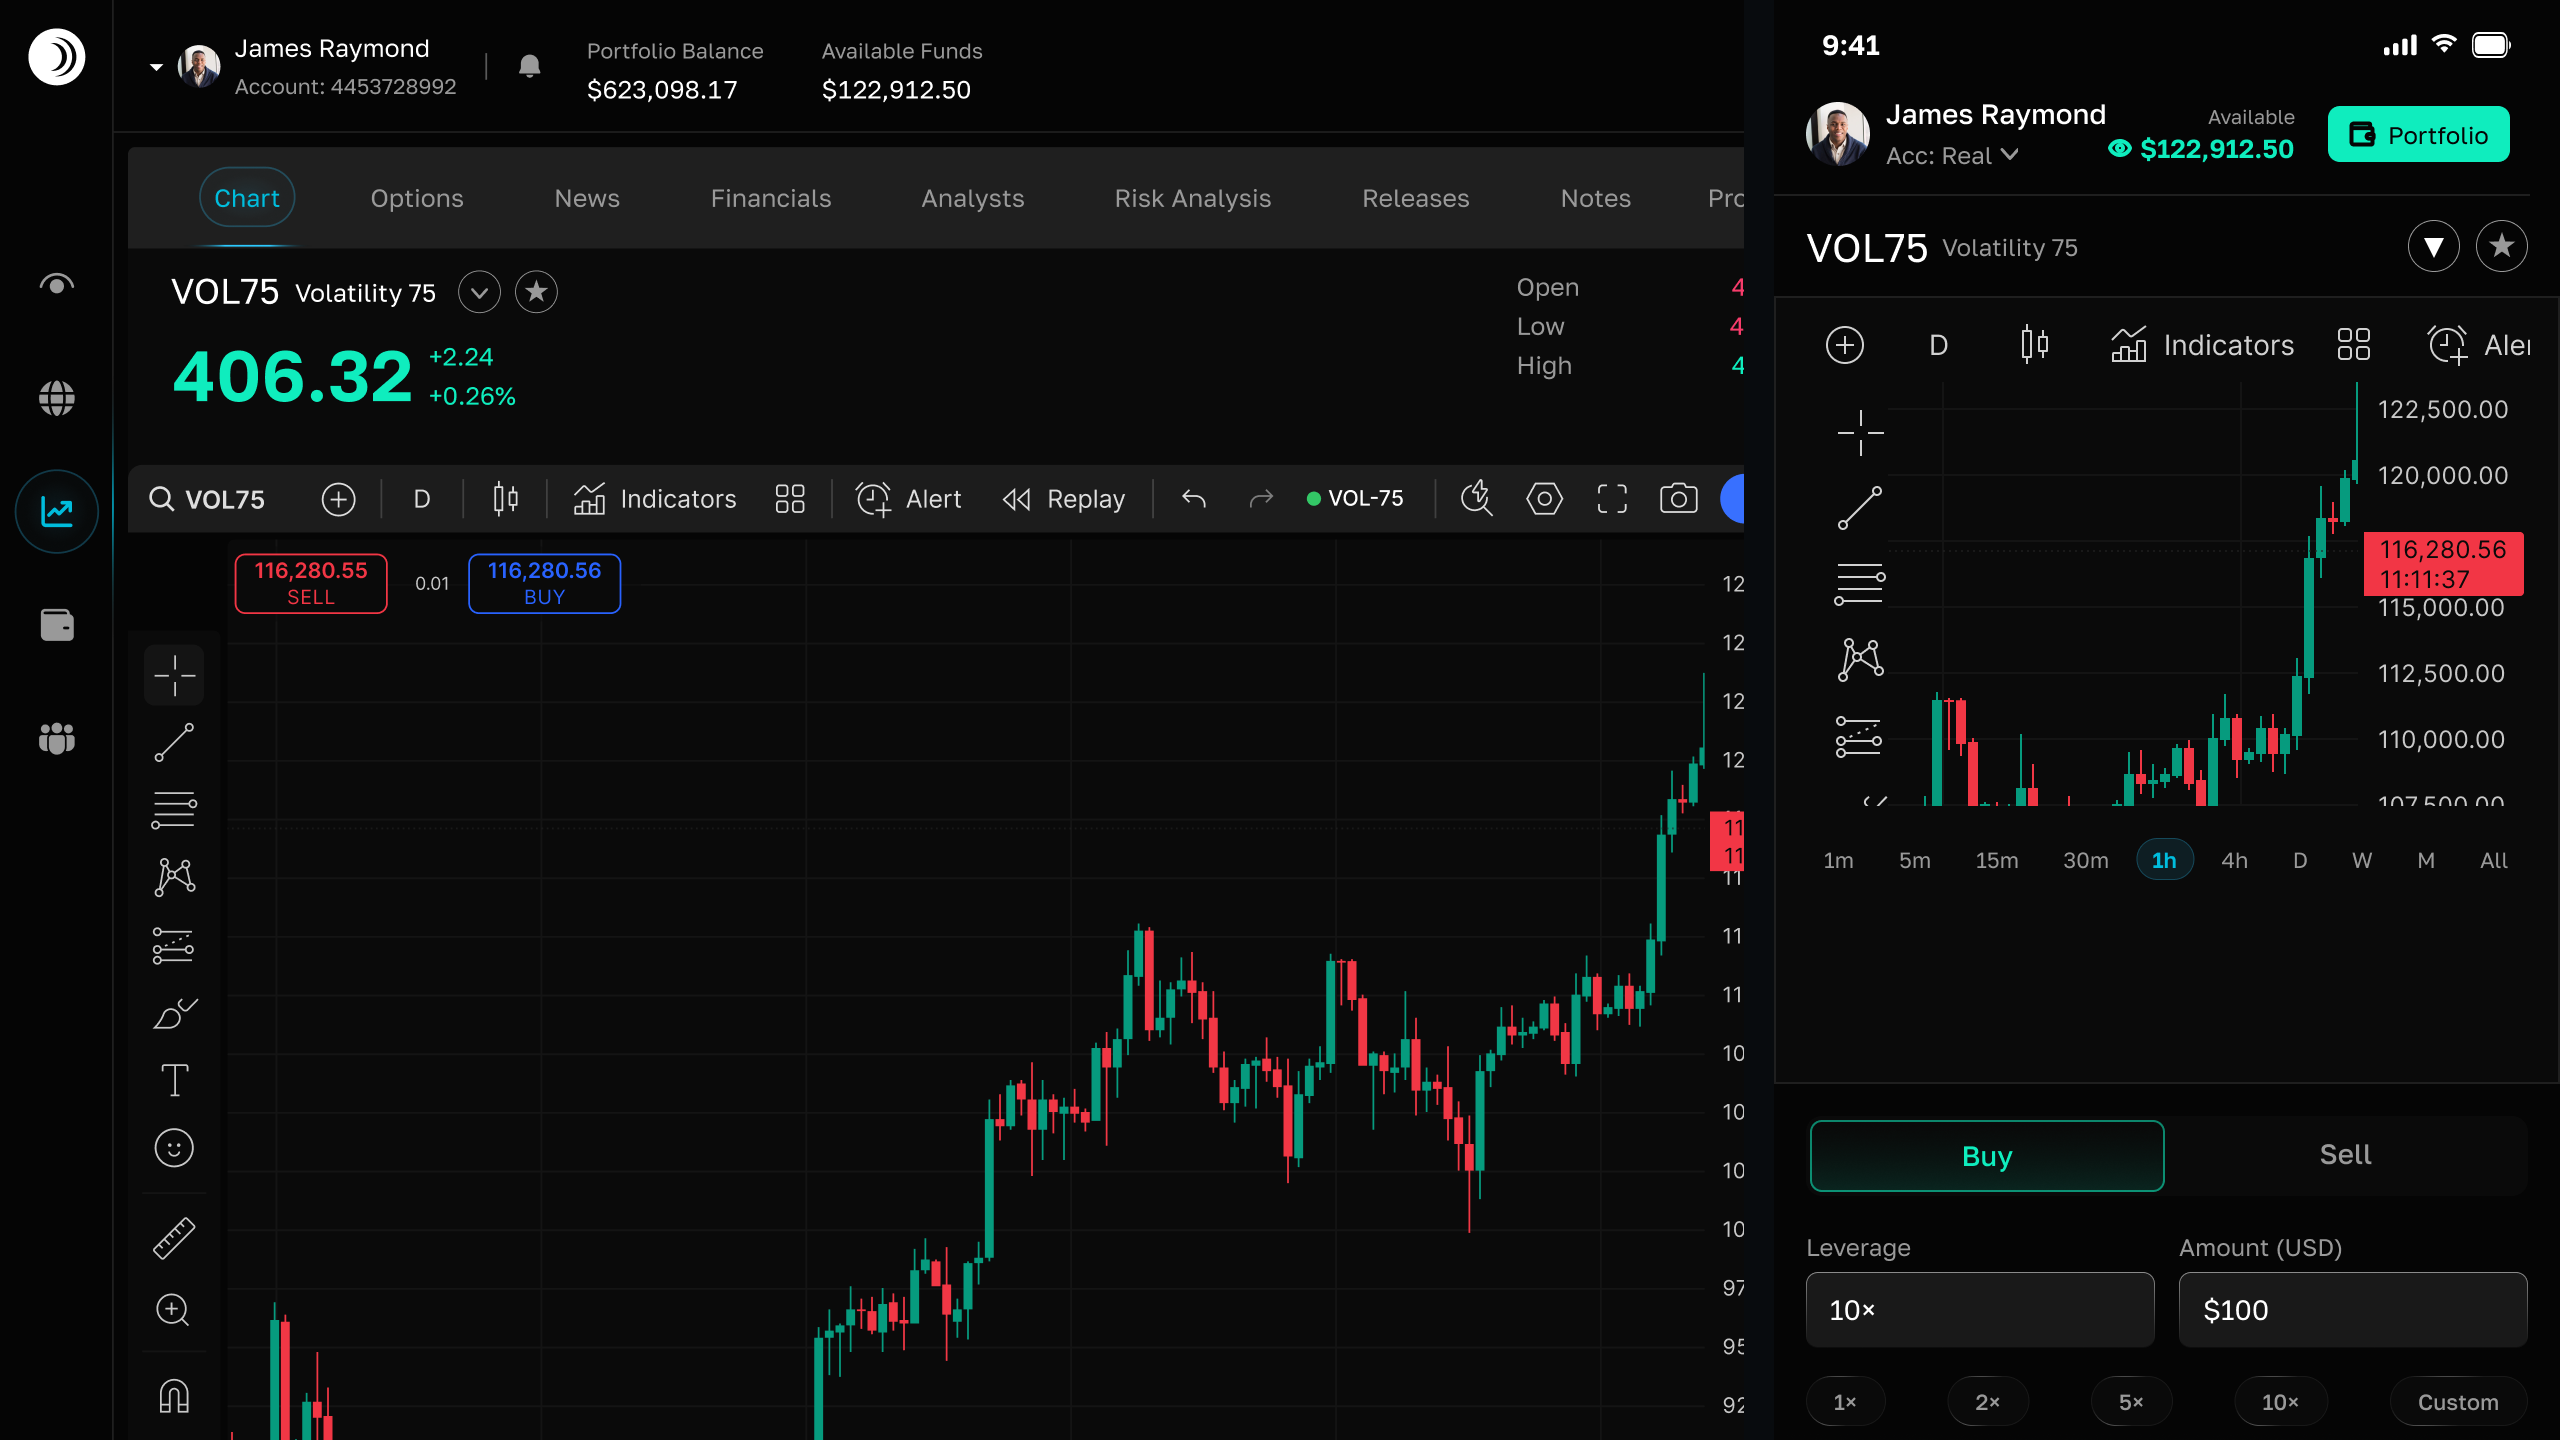
A crypto chart on Coinpes shows price history and current quotes for the pair you select. Use it to understand market movement and manage a Market position, not as a prediction or guarantee of a future price.
Choose the pair and time frame
Select a crypto pair from the Trade market selector, then use the chart time-frame controls to change how much price history you view. Shorter intervals can help you inspect recent moves, while longer intervals provide context.
Compare like with like. BTC/USDT and smaller-cap pairs can have very different price scales and ranges, so focus on the selected symbol, its direction, and the price axis.
Understanding the displayed price
The chart displays a current midpoint price from live bid and ask quotes. It is a market mark, not a promise that a later order or exit will use the identical price. Prices can move between reviewing the chart and submitting a trade.
Use the chart with the order form
- Confirm that the chart symbol matches the symbol on the order form.
- Choose Buy or Sell based on your own view, then review amount and leverage.
- Consider a stop-loss and take-profit as part of the position plan.
- Monitor open positions in Open Trades or Positions; changing charts does not close positions on other symbols.
A practical checklist
- Check the selected crypto pair and time frame.
- Review the current displayed price and recent range.
- Decide position size from your risk tolerance, not from a chart pattern alone.
- Monitor margin and profit or loss while the position is open.
Charts describe price activity; they do not provide investment advice. Use the demo account to practise before committing real funds.
Frequently asked questions
What price does the crypto chart show?

Related guides
 4 MIN
4 MINCrypto markets on Coinpes
Explore available crypto pairs, live price marks, and how crypto Market positions work on Coinpes.
3 MINCrypto market availability
Understand continuous crypto market availability, fast price moves, and how to manage positions at any time.
 5 MIN
5 MINMarket (Multipliers)
Open leveraged buy or sell positions on volatility indices — margin, fees, live P/L, and how Market differs from timed contracts.